Saturday, September 30, 2006

Time for Scribes


Mr. Kuropatwa introduced me to the world of Scribe Posts. It is an essential part of the Grade 8 Math Classroom. You will be expected to write one scribe post every 30 classes or about 4 a year. That doesn't sound like to much does it.

A Scribe post is

The assignment is simply to post a brief summary of what happened in class each day. A different student is responsible for the daily scribe post and they end their post by choosing the next scribe. The first scribe is a volunteer. The teacher's daily involvement is limited to updating a post called The Scribe List which is at the top of the links list in the sidebar of the class's blog.


To complete a scribe post the student must

Write a brief summary of what we learned in class today. Include enough detail so that someone who was away sick, or missed class for any other reason, can catch up on what they missed. Over the course of the semester, the scribe posts will grow into the textbook for the course; written by students for students. Remember that as each of you write your scribe posts. Ask yourself: "Is this good enough for our textbook? Would a graphic or other example(s) help illustrate what we learned?" And remember, you have a global audience, impress them.

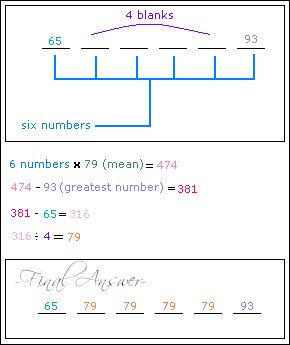
Here are examples of good scribe posts Pythagoras Scribe One Day In Math Algebra Masterpiece

Here are some scribe posts that have made The Scribe Post Hall of Fame.

When you are done your scribe post choose another student to be the scribe and label your post scribepost.


Wednesday, September 27, 2006

hey everybody

Monday, September 25, 2006

Measurement of Central Tendency Pretest

3. Find the Value of x in the data.

10, 12, 6, 6, 14, x, 8, 10, 12, 12, 8, 14

First, I arranged the data above in ascending order! Like shown below:

6, 6, 8,8,10,10,12,12,12,14,14, X

A) If the mean is 10. X= 8

Remember mean is also called an average. To get the mean you add up all the numbers in your data set(sum of all DATA). Then divide the sum of all data by the number of pieces of data( numbers) you used.
6+6+8+8+10+10+12+12+12+14+14+X
_____________________________________ = 10
12
6+6+8+8+10+10+12+12+12+14+14 = 112
Remember 10 x 12 is 120 so the sum of all data is 120.
120 - 112 = 8 so the x is 8
6+6+8+8+8+10+10+12+12+12+14+14
__________________________________ = 10
12
There is only one aswer to this question because 120- 112 is 8 and it couldn't be any other number.
B) If the mode is 12. X= 12
6, 6, 8, 8, 10, 10, 12, 12, 12, 12, 14, 14,
* 12 can be the x because if you add a 12, the mode will still be 12 because 12 is the data that appears the most.
There are other answer to this question but you have to make sure the more is 12. Your x could be 1, 2, 3, 4, 5, 7, 9, 11, 12, 13, 15 and so on. Your answer can't be 6, 8, 10 or 14 because they would become the mode since there are 2 datas of 6, 8, 10 and 14 and if you add 1 there would be 3 datas and 12 wouldn't be the mode anymore.
C) If the median is 11.Is there more than one possible answer for each question?
x = 14
6, 6, 8, 8, 10, 10, 12, 12, 12, 12, 14, 14, 14
10 and 12 are the middle 10 +12 = 22 / 2 = 11
There could be other answers to this question but your answer has to be higher than 12 because if you put a lower number the median won't be 11. Your answer could be a 12, 13, 14 and so on but make sure it is higher than 12.
If I made a mistake please kindly tell me so I could change it thank you!!
THYRZA MAY
8-41

Measures of Central Tendency Pretest

These are the answers for the first questions of this sheet...

Find a set of values to fit these conditions:

A) 1+4+5+10+15 = 35 35/5= 7

B) 1+2+3+8+10+10+8 = 42 42/7 = 6

C) 3+10+10+10+10+10+10 = 63 63/7 = 9

Leslie's Homework "Bill's History Marks"

Bill's history marks are: 72, 66, 65, 73, 71, 69, 68, 72.
Find the mean, mode, median and range.

65,66,68,69,71,72,72,73
Mean-69.5 Mode-72
Median-70 Range-8


A) If he scores 91 on the next test, which measure of central tendency will be most affected? Explain.

65,66,68,69,71,72,72,73,91
Mean-96.2222222222222Mode-72
Median-71 Range-26
The central tendency most affected was the range because eight to twenty is more of a difference then seventy and seventy-one. So range changed the most.

B) If he scores 66 on the next test, Which measure of central tendency will be most affected? Explain.

65,66,66,68,69,71,72,72,73
Mean-69.1111111111111 Mode-66 and 72
Median-69 Range-8
The central tendency most affected was mode because there is another mode now.

Leslie 8-41

Measure Of Central Tendency - Question 5

5. Find the measures of central tendency for the following data sets:

Note: "/" means to divide

A) 18, 20,26, 29, 30, 33, 40

Mean-
18+20+26+29+30+33+40= 196/7= 28
Median- 29
Mode- no mode
Range- 40-18=22

B)
15, 15, 17, 20, 20, 25, 25, 50 , 50

Mean-
15+15+17+20+20+25+25+50+50= 237/9= 23

Median- 20
Mode- 15, 20, 25, 50
Range- 50-15= 35

C)
5, 15, 20, 50, 75, 80

Mean-
5+15+20+50+75+80= 245/6= 41
Median- 20+50= 70/2= 35
Mode- no mode
Range- 80-5=75

D)
16, 16, 17, 40, 40, 40, 44, 64, 64, 80, 100

Mean- 16+16+17+40+40+40+44+64+64+80+100=521/11=47
Median- 40
Mode- 16, 40, 64
Range- 100-16=84

Measures of Central Tendency Pretest 2

Question 4: Mr. Thompson gave a test to six students who were absent. The highest score was 93 and the lowest score was 65. The mean of the test scores was 79. Create a list of six test scores that satisfy these conditions.
**Explain why your test scores satisfy these conditions.**
My Answer:

My answer's correct because it never said that you cannot have a mode. There can be more than one answer as long as the sum of all data equals 316.

pretest question #2

"The mean mark on 4 tests is 78%. What mark is needed on the next test to increase the mean to 80%?"

<===================================================>

78, 78, 78, 78 is possible for his test marks. so 78+78+78+78=312. And 312/2=4=78.

Knowing that 80x5 (the amount of datas we need) = 400, and 400-312(the previous sum of all data) =88, we need 88 as his mark. (78+78+78+78+88=400/5=80).

So 88% is needed on the next test to increase the mean to 80%.

-michael

Measures of central tendacy pretest 2 question 1

State 7 prices, where the median is $3.00, the highest price is $20.00 and the lowest price is $1.00

answer:

$1.00 , $2.00 , $2.00 , $3.00 , $11.00 , $15.00 , $20.00

Measure of Centeral Tendency Pretest 2

3. Julie buys a book, a game, a puzzle, and a piece of computer software at the book fair. The computer software cost $10. Julie claims that the average price of the items she bought is $ 2.50. Can she be correct why or why not?

The average of 4 items is $ 2.50, so the maximum amount of money is $ 10.00 on all the items in order to be true. The other 3 items have to be free because she already spend the maximum amount of $ 10.00. So she is incorrect.

Friday, September 22, 2006

Measures of Central Tendency Pretest 2

Here is the worksheet I provided you on Friday. Please answer the questions in a comment. You can also ask questions about anything you need help on here.

Good Luck

1. State 7 prices, where the median is $3.00, the highest price is $20.00 and the lowest price is $1.00.
2. The mean mark on 4 tests is 78%. What mark is needed on the next test to increase the mean to 80%?

3. Julie buys a book, a game, a puzzle, and a piece of computer software at the book fair. The computer software cost $10. Julie claims that the average price of the items she bought is $2.50. Can she be correct? Why or Why not.

4.
Mr. Thompson gave a test to six students who were absent. The highest score was 93 and the lowest score was 65. The mean of the test scores was 79. Create a list of six test scores that satisfy these conditions. Explain why your test scores satisfy these conditions.

5.
Find the measures of central tendency for the following data sets:


A) 33, 18, 40, 26, 29, 20, 30
B) 20, 50, 20, 50, 17, 15, 25, 50, 25, 15
C) 15, 20, 80, 75, 5, 50
D) 16, 40, 44, 16, 40, 40, 80, 17, 64, 64, 100

Measures of Central Tendency Pretest 1

Measures of Central Tendency Pretest

Here is the worksheet I provided you on Thursday. Please answer the questions in a comment. You can also ask questions about anything you need help on here.

Good Luck

1.Find a set of values to fit these conditions.

A) Five numbers with a mean of 7 and a median of 5.
B) Seven Numbers with a mode of 8 and a median of 6.
C) Seven numbers with a mode of 10 and a mean of 9.

2. Bill's history marks are: 72, 66, 65, 73, 71, 69, 68, 72.
Find the mean, mode, median and range.

A)
If he scores 91 on the next test, which measure of central tendency will be most affected? Explain.

B) If he scores 66 on the next test, Which measure of central tendency will be most affected? Explain.

3. Find the Value of x in the data.

10, 12, 6, 6, 14, x, 8, 10, 12, 12, 8, 14

A) If the mean is 10.
B) If the mode is 12.

C) If the median is 11.

Is there more than one possible answer for each question?


Tuesday, September 19, 2006

How to sign up

Here are the instructions for you to get your blogger account active.

A) Get a google account. You can do this from either blogger or google itself.

Your google account will be your email and a password you create.

B. You will use this account to access betablogger.

At Blogger you need to create a blog. Call it any thing and follow the steps.

Create 1 post and publish it.

***** Keep this window open for the next steps*****

Open a new browser window (control n)


Find the email I sent inviting you to the blog.

Do not click on this link but paste it into your address bar and hit enter.

Reenter your google password on the page provided.

YOu should see your class blog on your dashboard.

Delete your fake blog.

You are in business.

Friday, September 15, 2006

Oops Technical Problems

Dear 841. We have had technical difficulties. Your blog went down and decided not to get back up. I have created a new one but all your comments and invitations to participate in this blog have been lost. Please feel free to comment again on Barksalot and Why we blog. I will send out invitations again on Monday. Your google account will still be the ticket to participate.

Sorry for the inconvenience.

Harbeck

This Is My Life

A Graph of My Life


Estimate the amount of time you spend each weekday doing the following activities:

Playing
Attending school
Doing homework
Sleeping
Watching television
Other activities

Make a graph that represents your estimates. Please remember that there are 24 hours in a day!

This Assignment is due Thursday, September 14.
Please leave comments on this post if you have any questions.

Mr. Harbeck

Why we Blog

As I asked you in class "How many of you blog?" Most of you put up your hands because of your experience with Mr. Reece last year. Many of you also indicated that it was not you favorite activity during math class. I hope to change that this year. It is important to know that times are changing. The world you know now will be different by the time you enter highschool, and that world will change by the time you are ready to enter Highschool.

K. Fisch a teacher in Colorado created this powerpoint presentation for his students. It demonstrates how the world is changing. It is a remarkable presentation.

Did You Know

In your journals or as a comment I would like you to tell me what you are feeling after this presentation. Mr. Kuropatwa from Danial Mac asked his grade 11 and 12 students these questions:

  • What surprised you the most? Why was it surprising?

  • Did you learn anything? If so, what?

  • As you think about it now, does this change the way you think about school, learning or the purpose of getting an education? Is there anything you want to do differently related to school this year?

  • What Shift is happening?
How would you answer them?


Mr. Harbeck

Mr. Barksalot's Bath Graph

Welcome to your Math Blog. It is a place for you to post answers to questions and to communicate to the world about what happens in 8-17 Math. I would like you to leave a comment answering the following question. Some of this work will have to be done in your math journal. The bold print can be left as a comment.


Bobby fills a sink with enough water to wash his dog Mr. Barksalot. He then puts Mr. Barksalot in the sink and washes him. After he is finished he takes Mr. Barksalot out of the sink. Then he drains the sink.

Draw a graph that represents the level of water in the sink from the time paula started to fill the tub until the tub was empty. Clearly label your graph.

Explain what the graph should look like in a comment on this post AND on the back of your graph.

Mr. Harbeck

Welcome 8-41

In the coming days you will be given access to a wonderful tool. This blogsite is designed to be helpful and interactive. How much work you place on doing your posts and assignments will determine the greatness of the site.

Last year this is what 8-41 created. Let's do it again.

Mr. H